January Updates: CPU Insights, Deeper Stream Transparency & Uniform Design
Advanced CPU observations, enhanced video & network transparency, uniform design across all screens, and improved upload monitoring.
Posted by
Related reading
March Updates (2): One Score to Rule Them All, Tag Clouds, and Connectivity Deep-Dives
Version 1.3.0 introduces the Experience Score, six new connectivity observations, observation tag clouds, a richer overview, visual quality timelines, and Chrome 146 compatibility.
March Updates: API Access, Metadata, and a Smarter Knowledge Base
Version 1.2.0 introduces API access with Application Tokens, a revamped Knowledge Base, session tags and descriptions, new observations, and smarter AI summaries powered by Claude Sonnet 4.6.
February Updates: Showcase, Gold Credits & Smarter Connectivity Insights
Version 1.1.0 introduces the Showcase with YouTube integration, 5 Gold Credits for new accounts, and new connectivity observations.

Time for our first release of 2026 🥳🎆🥂
Since we had to hold ourselves longer than usual from our previous release, this update is packed with new features.
Our focus this time? To take your WebRTC debugging to the next level - moving beyond the network to look at the "silent killers" of call quality: CPU performance and hardware limitations.
We've also completely unified our design language across all platforms and added deep-dive metrics for video streams and network interfaces.
Let's dive in 🤿
🚀 Major Improvements
1. Advanced CPU & Performance Observations 🖥️
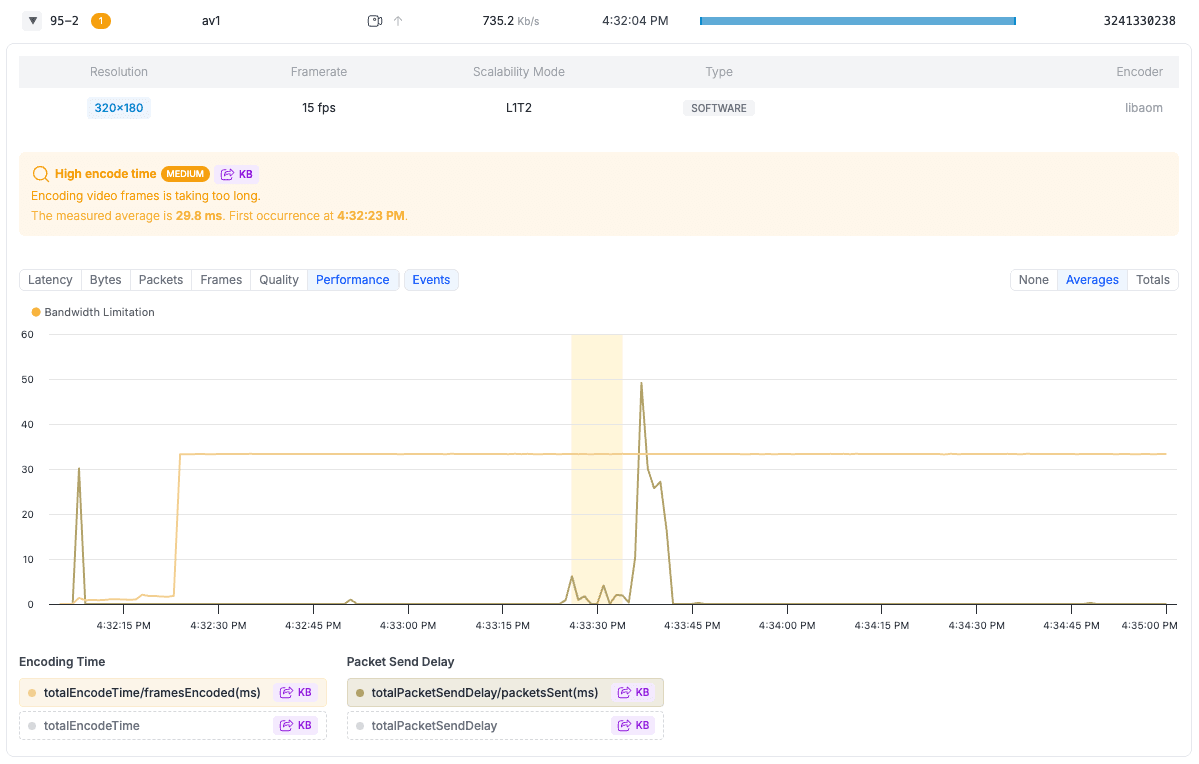
While network issues are often the primary suspect in a bad call, CPU bottlenecks are frequently the hidden culprit. In this release, we are introducing a comprehensive set of CPU Observations to help you identify when the device itself is the bottleneck.

Advanced CPU & Performance Observations
We can now detect and alert you to:
- Dropped Frames & Video Pauses: Identify when incoming frames are dropped before playout or when video playback hangs for extended periods
- High Freeze Durations: Automatically flag significant freezes that directly impact user experience
- Slow Encoding/Decoding: Spot performance bottlenecks in the processing pipeline
- Quality Limitation Reasons: We now surface why video quality is being limited. Is it High CPU Load, Bandwidth Constraints, or "Other" factors? Knowing the difference is the key to choosing the right optimization path
2. Enhanced Video & Network Transparency 🔍
We've added a wealth of metadata to help you understand the "How" and "Where" of your connections:
- Network Interface Grouping: Local candidates are now displayed and grouped by network interface, making it much easier to see which specific NIC (WiFi, Ethernet, VPN) is being utilized by the Peer Connection
- Detailed Video Stream Info: Each video stream now displays the most used resolution and framerate, providing a clearer picture of the actual quality delivered
- Hardware vs. Software: We now explicitly show encoder/decoder information, including whether hardware acceleration is being utilized - a vital metric for debugging CPU issues
- Scalability Mode: For advanced use cases (like SVC), we now display the scalability mode and rid directly in the stream view

Network Interface Grouping
3. Uniform Design Across All Screens 🎨
We have overhauled the visual experience to ensure rtcStats feels native and polished, no matter where you access it. By standardizing our design system, we've brought a new level of consistency to the platform:
- Unified UI Elements: We've synchronized fonts, icons, and UI components across the entire application. Whether you are on the public sharing site or the main dashboard, the experience is seamless
- Full Tablet Support: The UX is now fully optimized for tablets. We've introduced a collapsible sidebar to maximize screen real estate for your charts and data
- Performance Tweaks: Under-the-hood optimizations ensure that the interface remains snappy and responsive even on mobile and tablet browsers especially when visiting rtcstats.com

Uniform Design Across All Screens
🛠️ Other Improvements
This release also brings several quality-of-life updates and smarter detection logic:
- Potential audio issue: We have added a new observation to detect no audible incoming streams, helping you quickly identify audio routing or hardware issues even when the signaling suggests a connection is active
- Observation Breadcrumbs: Navigation is now easier with observation counters per severity acting as breadcrumbs
- Knowledge Base Badges: You'll now see KB badges directly on pair graphs, linking you instantly to documentation for metrics like totalRoundTripTime
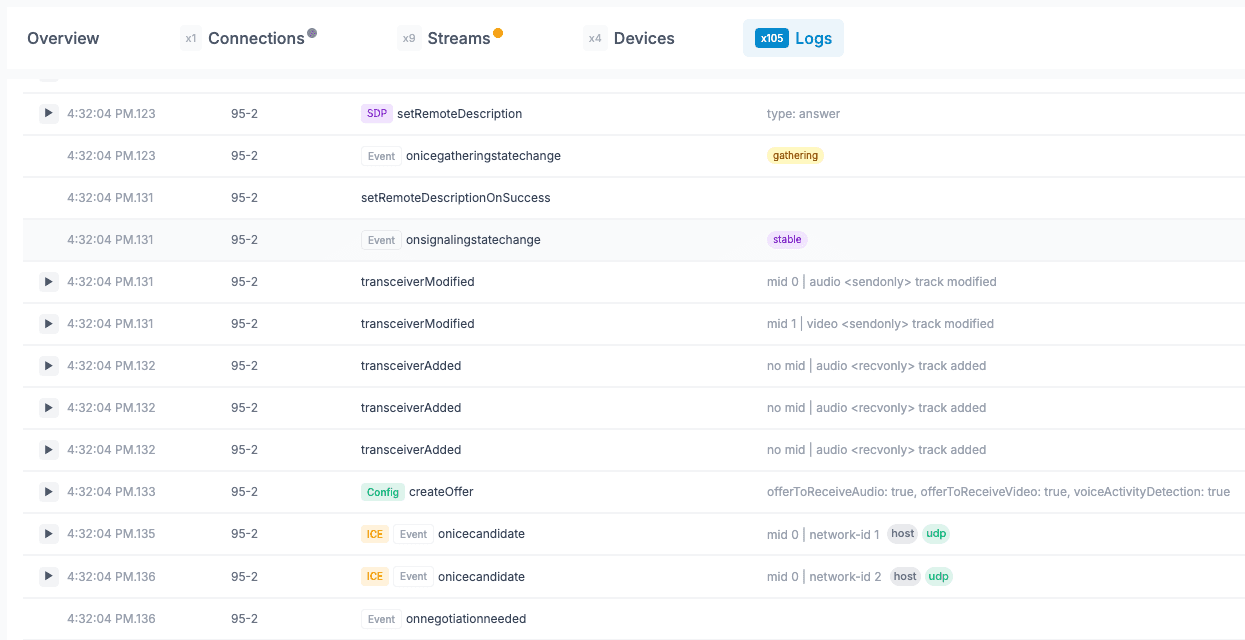
- Enhanced Logs: The logs component now features better readability and improved event value formatting
🐞 Bug Fixes
As always, we've been squashing bugs to keep the platform stable:
- Public Sharing Fix: Resolved a crash in the public sharing view, preventing the session to be seen
- Data Channels: Fixed a transport assembly issue for connections that only utilize data channels. In this case, channels were not displayed
- Accuracy: Improved the detection logic for Packet Loss observations and fixed missing timestamps in certain observation logs
- Stability: Fixed several crashes related to MIME type parsing and observation processing
Addressing Upload Issues
We detected several issues when uploading files, mainly due to our analysis engine. We have implemented specific fixes and have upgraded our monitoring; our team is now immediately informed whenever a file fails to upload so we can fix the issue quickly. We apologize for the inconvenience and hope most of these issues will be resolved with this update.
We're confident that these new CPU insights and design improvements will make your WebRTC debugging faster and more effective.